Documentation · Operating
Setting up metrics and Grafana
This page is an outline. What is here is accurate, but it is
not yet the whole story — each section ends with a note on what is still to be
written. For anything it does not answer, DEPLOYMENT.md and
USING-MCP.md in the repository are the complete references.
There are TWO endpoints, and they are easy to confuse
If your dashboard is empty, this is almost certainly why.
| Container health | Per-tool MCP metrics | |
|---|---|---|
| Where | The console, :8080/metrics | Each generated server, MCP_METRICS_PORT (e.g. :9464) |
| How many | One per container | One per running config |
| Switch | Always on — nothing to enable | PROMETHEUS_SERVER=YES and a port |
| Series | mcpdbwizard_container_* | mcpdbwizard_mcp_* |
A scrape config aimed only at 9464 collects no mcpdbwizard_container_* at all, and Grafana shows
an empty panel with no error anywhere.
scrape_configs:
  - job_name: mcpdbwizard-container        # CPU / memory / disk, one per container
    static_configs:
      - targets: ['mcpdbwizard-web:8080']

  - job_name: mcpdbwizard-mcp              # per-tool call metrics, ONE TARGET PER SERVER
    static_configs:
      - targets:
          - 'mcpdbwizard-web:9464'
          - 'mcpdbwizard-web:9465'         # one line per running server - see step 2
That 9464 is one server, not all of them. Every generated server is its own process binding
its own socket, so there is no single MCP port they share the way the console’s :8080 is shared.
Prometheus will not expand a port range for you, so a static list needs a line per server.
If the deployment allocates ports, use service discovery instead of a static list — the console
publishes the running servers and their ports at /sd/mcp, so the scrape configuration stops naming
ports that move:
  - job_name: mcpdbwizard-mcp
    http_sd_configs:
      - url: http://mcpdbwizard-web:8080/sd/mcp
        authorization:
          type: Bearer
          credentials: <api-token>          # an admin issues one on the Users page
Which of the two to use is step 2’s choice, and step 3 covers the credential.
Turning on the per-tool metrics
Two switches, and you need both. PROMETHEUS_SERVER=YES in the config emits the collection and
the endpoint at generation time; MCP_METRICS_PORT at run time is what actually binds a socket.
There is deliberately no default port — the console runs up to twenty generated servers at once,
and a default would give one a socket and the rest a bind failure. Either set
mcpdbwizard.runtime.metrics-port-range (e.g. 9464-9483) and let the deployment allocate one per
server, or name a port per config on the Service Options tab for a scrape target that stays valid
across restarts.
What you get
Every series carries six labels — host, config, server, tool, db_object and
object_type:
| Metric | Type | What it answers |
|---|---|---|
mcpdbwizard_mcp_calls_total | counter | call count, also split by outcome |
mcpdbwizard_mcp_call_duration_seconds{quantile} | summary | p50, p75, p90 over the last 2048 calls to that tool |
mcpdbwizard_mcp_call_duration_seconds_max | gauge | the worst call since start-up |
mcpdbwizard_mcp_request_bytes_total / _response_bytes_total | counter | inbound and outbound JSON volume |
mcpdbwizard_mcp_pool_* | gauge/counter | the POOL-STATS numbers, without parsing a log |
host and config are what keep many servers apart. Scraping a dozen ports into one
Prometheus needs no relabelling to stay readable: config carries the name the console knows a
server by (the deployment sets it; override it with MCP_METRICS_CONFIG_LABEL), so sum by (config) separates them and dropping the label aggregates the estate.
db_object is the label that matters, and it is why this needs a generation-time flag at all. A
tool name is a flattened Oracle name and one object yields several tools, so nothing at run time
could map one back to PAYROLL.EMPLOYEE_PKG.GET_BALANCE. The generator writes the mapping into the server, so
sum by (db_object) needs no join.
Setting it up, end to end
Five steps. The first two are where people lose an afternoon.
1. Turn the per-tool metrics on, per config
PROMETHEUS_SERVER=YES is a generation-time flag — Design → Service Options → Prometheus
server, then regenerate. It bakes the collection and the endpoint into that server. A config
generated without it produces no per-tool metrics no matter what you set at run time.
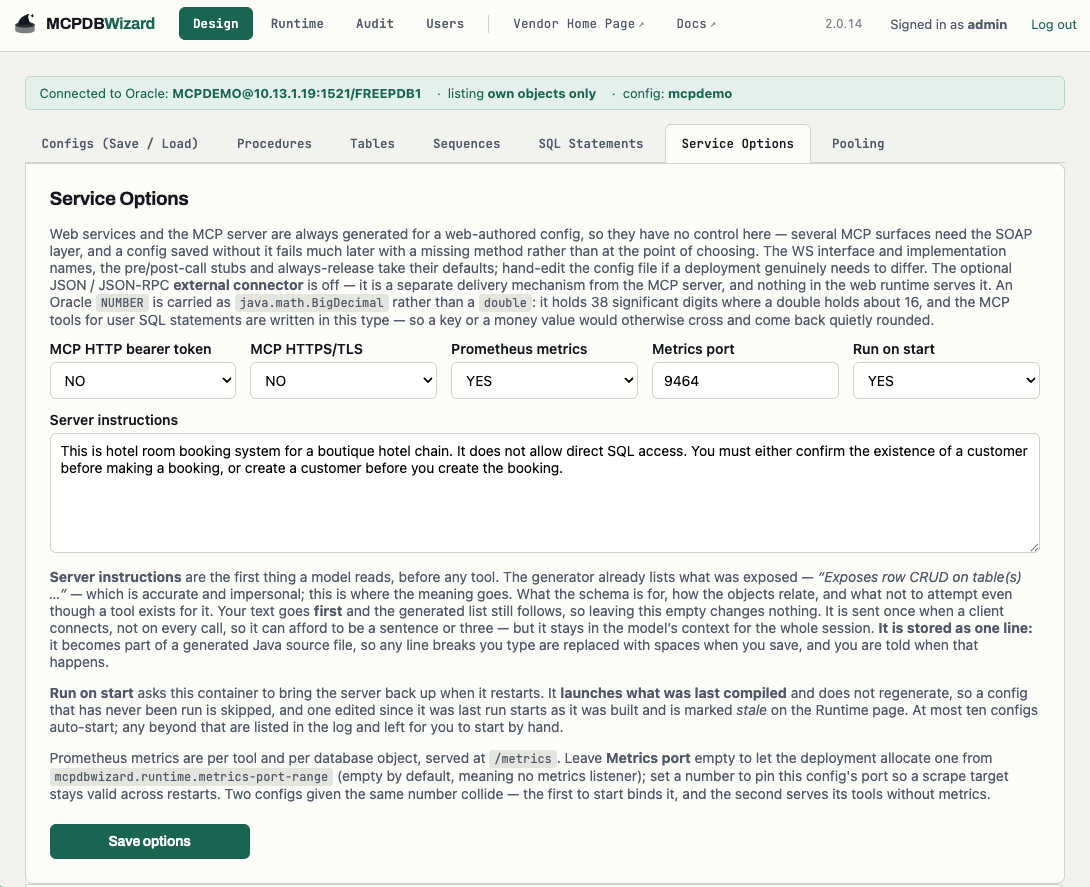
mcpdbwizard.runtime.metrics-port-range instead. Below what is shown here the same tab lists every tool the config exposes, where their descriptions are written.2. Give the servers somewhere to bind
Nothing binds a metrics socket until a port is named. Either:
- Let the deployment hand them out — set
mcpdbwizard.runtime.metrics-port-range(e.g.9464-9483), and each server that starts gets one. It probes and skips, so two servers can never collide. Simplest to run, and the cost lands at the scrape end: a server’s port can change across restarts, and listing the whole range as targets leaves the ports with nothing on them sittingDOWNin Status → Targets. Service discovery removes that cost — see step 3 — which makes the range the better default once it is set up. - Or pin one per config — Design → Service Options → Metrics port. Use this when the scrape target has to stay valid across restarts. A pinned port is deliberately not probed first, so two configs given the same number do collide: the first to start binds it, and the second logs that and serves its tools without metrics.
Then let them out of the container by publishing the range:
    ports:
      - "8080:8080"
      - "9464-9483:9464-9483"
On 2.0.9 and earlier that is not enough — add MCP_METRICS_HOST: "0.0.0.0" alongside it. The
listener bound 127.0.0.1 inside the container, and a published port forwards to the container’s
bridge address, so the scrape was refused with nothing in the log to explain it. From 2.0.10 the
console sets that address for the servers it launches, and setting it yourself still wins.
3. Point Prometheus at both endpoints
Use the scrape config at the top of this page. Both jobs, or half the dashboard is empty.
The container job needs no credentials — :8080/metrics is open, because it carries utilisation
percentages and nothing else. The generated servers’ own /metrics ports are open for the same
reason of practicality, though they do publish your schema’s object names.
Service discovery is the exception, and it is authenticated. /sd/mcp answers with your config
names, and a config name is a schema and often a customer — so unlike the two metrics endpoints it
is not open to anything that can reach the console. It takes the same API token as the MCP proxy:
- An admin issues one on the Users page, as
<id>.<secret>. - Prometheus sends it as
authorization.credentialson thehttp_sd_config. - The list is filtered by that token’s account, through the same access matrix that governs every other surface. A monitoring account granted every config discovers every server; a token granted one config discovers one. If targets are missing, check the matrix before suspecting the scrape.
Behind a reverse proxy that terminates the console but not the metrics ports, set
mcpdbwizard.runtime.sd-advertised-host — discovery otherwise advertises the host name the request
arrived on, which is the proxy’s and not where the scrape has to go.
Check Prometheus agrees before going near Grafana: Status → Targets should show both jobs UP.
If the MCP job is down, step 1 or 2 is why. A 401 in the Prometheus log is the token; an empty
target list with no error is the access matrix.
curl -s localhost:8080/metrics | grep -c mcpdbwizard_container_    # expect > 0
curl -s localhost:9464/metrics | grep -c mcpdbwizard_mcp_          # expect > 0 after one tool call

# Service discovery, if you are using it. [] means nothing running, or nothing this token may see.
curl -s -H "Authorization: Bearer <api-token>" localhost:8080/sd/mcp
4. Add Prometheus to Grafana
Connections → Data sources → Add new data source → Prometheus, URL
http://prometheus:9090 (or wherever it runs), then Save & test.
5. Import the dashboard
Download the dashboard, then in Grafana: Dashboards → New → Import → Upload JSON file, and pick the data source from step 4 when it asks.
Make one tool call before judging it. Every per-tool series is created by the first call to that tool, so a freshly imported dashboard on a freshly started server is legitimately empty — which looks identical to a broken scrape.
A dashboard to start from
Download the Grafana dashboard — 11 panels over the metrics above, imported in step 5.
It expects both scrape jobs: panels fed by mcpdbwizard_container_* stay empty if you only
scrape the MCP port, which is the confusion at the top of this page arriving by another route.
Treat it as a starting point and the panels as worked examples of the PromQL. Cut the ones that do not match how you run this.
Alert on absence, not only on errors
A call rejected by input-schema validation is not counted — the SDK checks the schema before the handler the metrics live in. A client sending malformed arguments therefore shows up as no traffic, not as failures.
The endpoint is unauthenticated and binds loopback
Run outside a container, the listener binds 127.0.0.1 unless told otherwise. Measuring a
server must not be the act that puts it on a network, so a generated server started by hand keeps
its scrape endpoint on the machine until you say otherwise.
Inside the container the console binds every interface (from 2.0.10), because nothing proxies
/metrics the way the /mcp/{owner}/{config} proxy fronts the tool surface — loopback there would not
channel access, it would eliminate it. The container’s namespace is the boundary instead, and
publishing the port is the deliberate act that crosses it.
Either way the endpoint is unauthenticated. It is read-only and carries no data from the
database, but it does publish your schema’s object names and your traffic shape, so put a network
policy in front of the published port. Setting MCP_METRICS_HOST by hand logs a warning saying so.
In a container both of these must agree — the config’s PROMETHEUS_SERVER and the port range —
and both default to off. See
Publishing the metrics port for the table and the
commands that say which one is biting.